Analytics Dashboard
This new feature is available for SFS Billing and Payments users.
Work is progressing to develop similar analytics for Collection Management users and is expected to be available soon.
The Analytics Dashboard is designed to provide you with high-level information about system usage and trends over time. The data visualizations display what's happening in the SFS and are designed to provide useful insights.
Analytics are intended to complement operational reporting which already exists and will continue to be supported and improved. The Analytics Dashboard does not contain any individually identifiable user information, operational reports can be used in cases where individual identifiable information is needed, such as reconciliations.
The Analytics Dashboard information cannot be downloaded or exported.
The Analytics Dashboard page is made up of 5 different tabs that display data visualizations of real time information in various charts and graphs:
-
Payments tab
-
Payment Plans tab
-
International tab
-
eRefunds tab
-
User Activity tab
You must have the correct permissions configured to access the Analytics Dashboard. If you want to access the Analytics Dashboard but do not see the option, the permission is controlled with the Ability to access the analytics dashboard permission on the Edit User page.
If you need access, please contact the Flywire administrator at your institution or contact Flywire Support at [email protected].
Cross Filtering Information
On each tab you can filter the data displayed to find the aspects that are most useful to you. Cross filtering gives you an easier way to dig deeper into the data.
For each chart or graph, you can hover over the information to get more details.
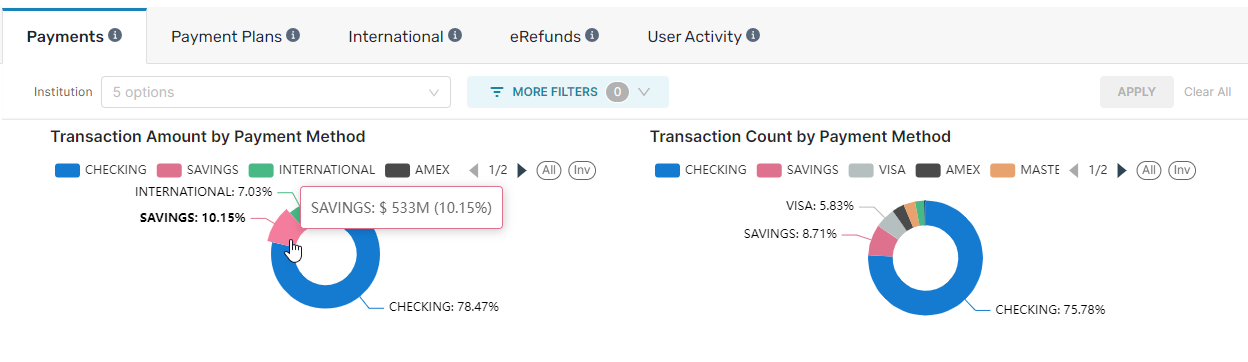
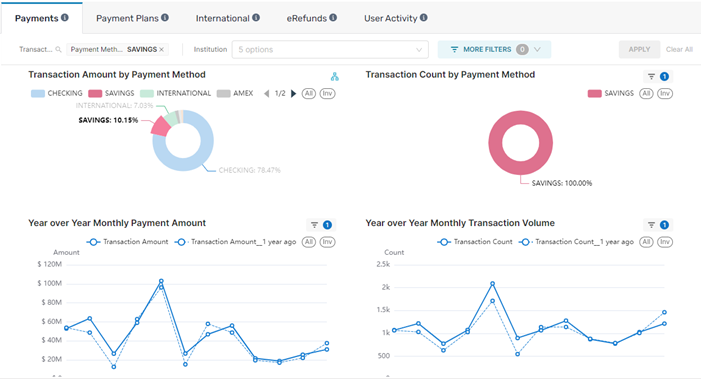
If you click on a segment, all of the charts and graphs on the tab will filter to focus on that information. For example, in the pie chart above, you can click on the Savings payment method. The other charts and graphs are filtered for that information and the filter updates to show what you selected. You can select information in another chart to further filter the displayed information.
Billing and Payments Tabs and Filters
As a default, all tabs display information for your entire institution and all sub-institutions. You can use the filters and cross filtering to display more specific information. The information on the Analytics Dashboard is updated daily and there is a time stamp on each tab to let you know when the data was collected. For most tabs, the time stamp is located in the upper left corner.
The information in the dashboard is updated daily at 9 am UTC.
Payments tab
The Payments tab displays information on all payments processed in the SFS. This total includes student and Authorized User payments, collection payments, and secure checkout/eStore payments (if applicable).
On this tab you can find data about:
-
Payment amounts
-
Counts of transactions
-
Payment methods
-
Users (students vs Authorized Users)
You can use the following filters to update the charts and graphs:
-
Select the institutions from which you want to view data. You can use the drop-down to select a custom combination of institutions.
 Institutions
Institutions are configuration records that specify your SFS setup. Every Student Financial Software (SFS) system is required to have a 'root' institutions and you can add as many sub-institutions as needed for your configuration.
-
Select the type of canonicals from which you want to view data. You can use the drop-down to select a custom combination of canonical types.
Canonical Header
The canonical header defines the type of canonical. For example, a tuition canonical or collection canonical.
-
Select the academic terms from which you want to view data. You can search and select a custom combination of terms.
Terms
A term is a period of time where you offer courses. You configure the term during setup with your Relationship Manager. You can view the term setup on the Academic Term Configuration page.
-
Select the time span you want to see by changing the Date Range picker.
Payment Plans tab
The Payment Plans tab displays information on tuition payment plans for current students.
This view does not include On Demand or Collection payment plans.
On this tab you can find data about:
-
Plan counts
-
Plan amounts
-
Plan status
-
Number of plan activations
-
Balance remaining
-
Number of installments
-
Types of users enrolling in plans
You can use the following filters to update the charts and graphs:
-
Select the canonicals from which you want to view data. You can use the drop-down to select a custom combination of canonicals.
Canonicals
A canonical is an identifier code for your institutions and sub-institutions. Each of your institutions have a unique canonical specific to that institution. When your institution is setup, you have a root institution with the base canonical. Each sub-institution's canonical will include the base canonical in their code, but will be updated so each institution has a unique code.
-
Select the academic terms from which you want to view data. You can search and select a custom combination of terms.
Terms
A term is a period of time where you offer courses. You configure the term during setup with your Relationship Manager. You can view the term setup on the Academic Term Configuration page.
-
Select the time span you want to see by changing the Payment Plan Activation Date in the date picker.
International tab
The International tab displays data for international payments and payment plans initiated from within SFS.
If you have multiple portals for international payments, you can view analytics for additional portals in the Flywire Dashboard.
On this tab you can find data about:
-
Number of international payments
-
Amount of international payments
-
Currency of origin
-
Country of origin
-
Number of international plan activations
-
International plan status information
You can use the following filters to update the charts and graphs:
-
Select the institutions from which you want to view data. You can use the drop-down to select a custom combination of institutions.
Institutions
Institutions are configuration records that specify your SFS setup. Every Student Financial Software (SFS) system is required to have a 'root' institutions and you can add as many sub-institutions as needed for your configuration.
-
Select the time span you want to see in the Date Range picker.
-
Select the country you want to see payments from in the Country From picker. The Country From is the country where the payment originated from.
eRefunds tab
The eRefunds tab displays data for outgoing ACH transactions in the SFS. It does not include information about refunds of specific payments.
On this tab you can find data about:
-
Number of eRefunds
-
Amount of eRefunds
-
Type of processing (ACH vs Check)
You can use the Institutions filters to select the institutions from which you want to view data. You can use the drop-down to select a custom combination of institutions.
Institutions are configuration records that specify your SFS setup. Every Student Financial Software (SFS) system is required to have a 'root' institutions and you can add as many sub-institutions as needed for your configuration.
User Activity tab
The User Activity tab displays data for users of the SFS. It includes data from all parts of the SFS, including billing and payment and collection management.
On this tab you can find data about:
-
Type of events by category
-
Type of events by event name
-
Number of events
-
Events over time by month
-
Communication method
You can use the following filters to update the charts and graphs:
-
Select the institutions from which you want to view data. You can use the drop-down to select a custom combination of institutions.
Institutions
Institutions are configuration records that specify your SFS setup. Every Student Financial Software (SFS) system is required to have a 'root' institutions and you can add as many sub-institutions as needed for your configuration.
-
Select the group of user events from which you want to view data. You can use the drop-down to select a custom combination of groups.
-
Select the time span you want to see in the Date Range picker.
FAQs
The Analytics Dashboard information cannot be downloaded or exported.
Analytics are intended to complement operational reporting which already exists and will continue to be supported and improved. The Analytics Dashboard does not contain any individually identifiable user information, operational reports can be used in cases where individual identifiable information is needed, such as reconciliations.
